IMBIE Study Finds Greenland, Antarctica Lost 11.3 Trillion Tons of Ice
Greenland
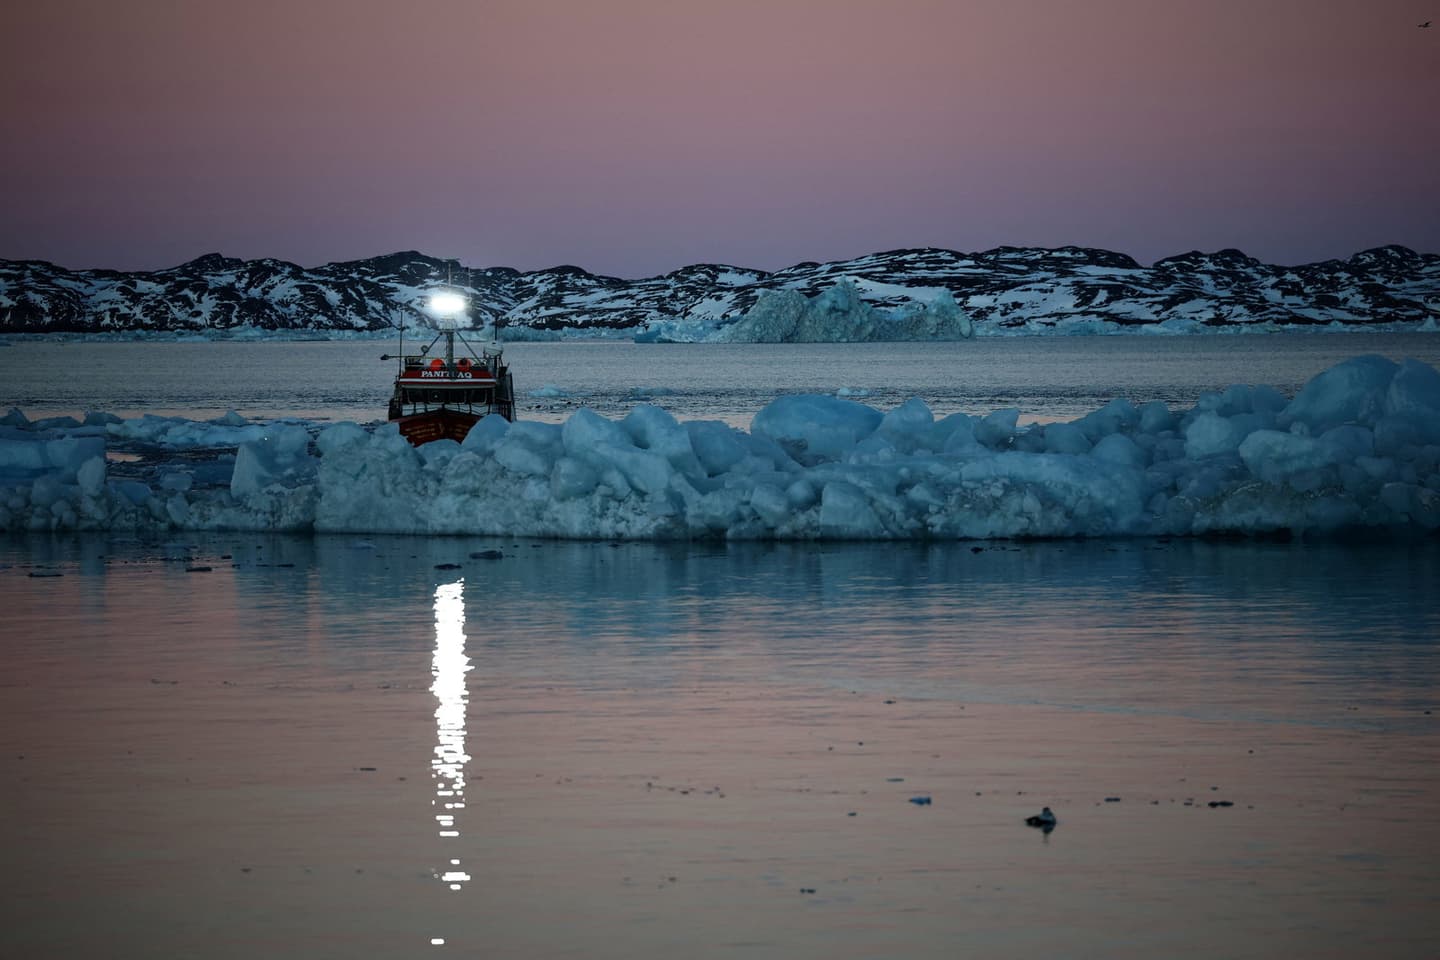
Stoyan Nenov/Reuters
Source Analysis




What Happened
What Happened
Where Sources Agree
- arrows_inputPolar Ice Loss Confirmed: Most sources document that Greenland and Antarctica have lost 11.3 trillion metric tons of ice since the 1970s, contributing to a global sea-level rise of 1.1 inches, according to findings published in the IMBIE study.
- arrows_inputPrimary Drivers of Ice Loss: Several reports converge on the finding that 84% of polar ice loss results from dynamic glacier discharge into the ocean, while only 16% stems from surface melting, indicating the long-term trend is driven by a warming ocean, according to the IMBIE study analysis.
- arrows_inputIce Loss Trend Continuity: Reporting predominantly indicates that while ice loss rates slowed between 2020 and 2023 due to short-term weather patterns, the long-term trend of accelerating mass loss from Greenland and Antarctica remains unchanged, according to study authors.
Where Sources Disagree
- arrows_outputIce Loss Measurement Units: Reports vary on the total volume of ice lost from Greenland and Antarctica, with some outlets citing 11.3 trillion metric tons, while others report 12.5 trillion US tons.
- arrows_outputSea Level Rise Estimates: Reports vary on the estimated global sea level rise attributed to ice sheet loss since the 1970s; some outlets cite a rise of 1.1 inches or 3 centimeters, while others report figures of 1.2 inches, 3.1 centimeters, or 3.2 centimeters.
- arrows_outputStudy Timeframe Discrepancy: Reports on the study's duration vary, with some sources citing a 50-year record starting in 1972, while others characterize it as a 47-year timeframe beginning in 1979.
Timeline
September 16, 2026
Half-century ice loss quantified: The IMBIE assessment found the two ice sheets lost about 11.3 trillion metric tons of ice between 1979 and 2023, which raised global sea levels by roughly 31.4 millimetres (about 3.1 centimetres). The result was published in Scientific Data and presented as the most complete multi-decade reconciliation of satellite estimates to date.
September 16, 2026
Satellite record extended: The IMBIE study combined multiple satellite missions and independent surveys to extend the ice-sheet record back to 1972 for Greenland and 1979 for Antarctica, enabling a half-century-long view of ice-sheet change. The team drew on data from 27 satellite missions and 42–45 independent surveys to build the long-term record.
December 31, 2023
Drivers, short pause, and impacts: The study found more than four-fifths (about 84%) of the combined ice loss came from glacier discharge into the ocean driven by warming waters, not surface melt; a temporary slowdown occurred between 2020 and 2023 due to unusual East Antarctic snowfall and milder Greenland summers, but authors say the pause likely reflects short-term weather variation and the accelerating trend resumed. The resulting sea-level contribution places millions (an estimated 6–9 million or ~2–3 million per cm) more people at annual coastal flooding risk.
Summaries by Ground AI
Sources
See All 158Most Written About
The stories getting the most coverage from the last 24 hours


Source Analysis
Timeline
September 16, 2026
Half-century ice loss quantified: The IMBIE assessment found the two ice sheets lost about 11.3 trillion metric tons of ice between 1979 and 2023, which raised global sea levels by roughly 31.4 millimetres (about 3.1 centimetres). The result was published in Scientific Data and presented as the most complete multi-decade reconciliation of satellite estimates to date.
September 16, 2026
Satellite record extended: The IMBIE study combined multiple satellite missions and independent surveys to extend the ice-sheet record back to 1972 for Greenland and 1979 for Antarctica, enabling a half-century-long view of ice-sheet change. The team drew on data from 27 satellite missions and 42–45 independent surveys to build the long-term record.
December 31, 2023
Drivers, short pause, and impacts: The study found more than four-fifths (about 84%) of the combined ice loss came from glacier discharge into the ocean driven by warming waters, not surface melt; a temporary slowdown occurred between 2020 and 2023 due to unusual East Antarctic snowfall and milder Greenland summers, but authors say the pause likely reflects short-term weather variation and the accelerating trend resumed. The resulting sea-level contribution places millions (an estimated 6–9 million or ~2–3 million per cm) more people at annual coastal flooding risk.


